What the product graph is
The product graph describes your software along two orthogonal vectors:
A single feature spans multiple layers; a single layer implements many features. Relationships tie the two vectors together — providers, state stores, custom hooks,
service classes, and cross-cutting concerns like auth, logging, and analytics.
Confidence is first-class. Every entity in the graph has a detection method and a confidence score. When Kasava is uncertain, it says so — it doesn’t fake precision.
The differentiator: code structure + commit analysis
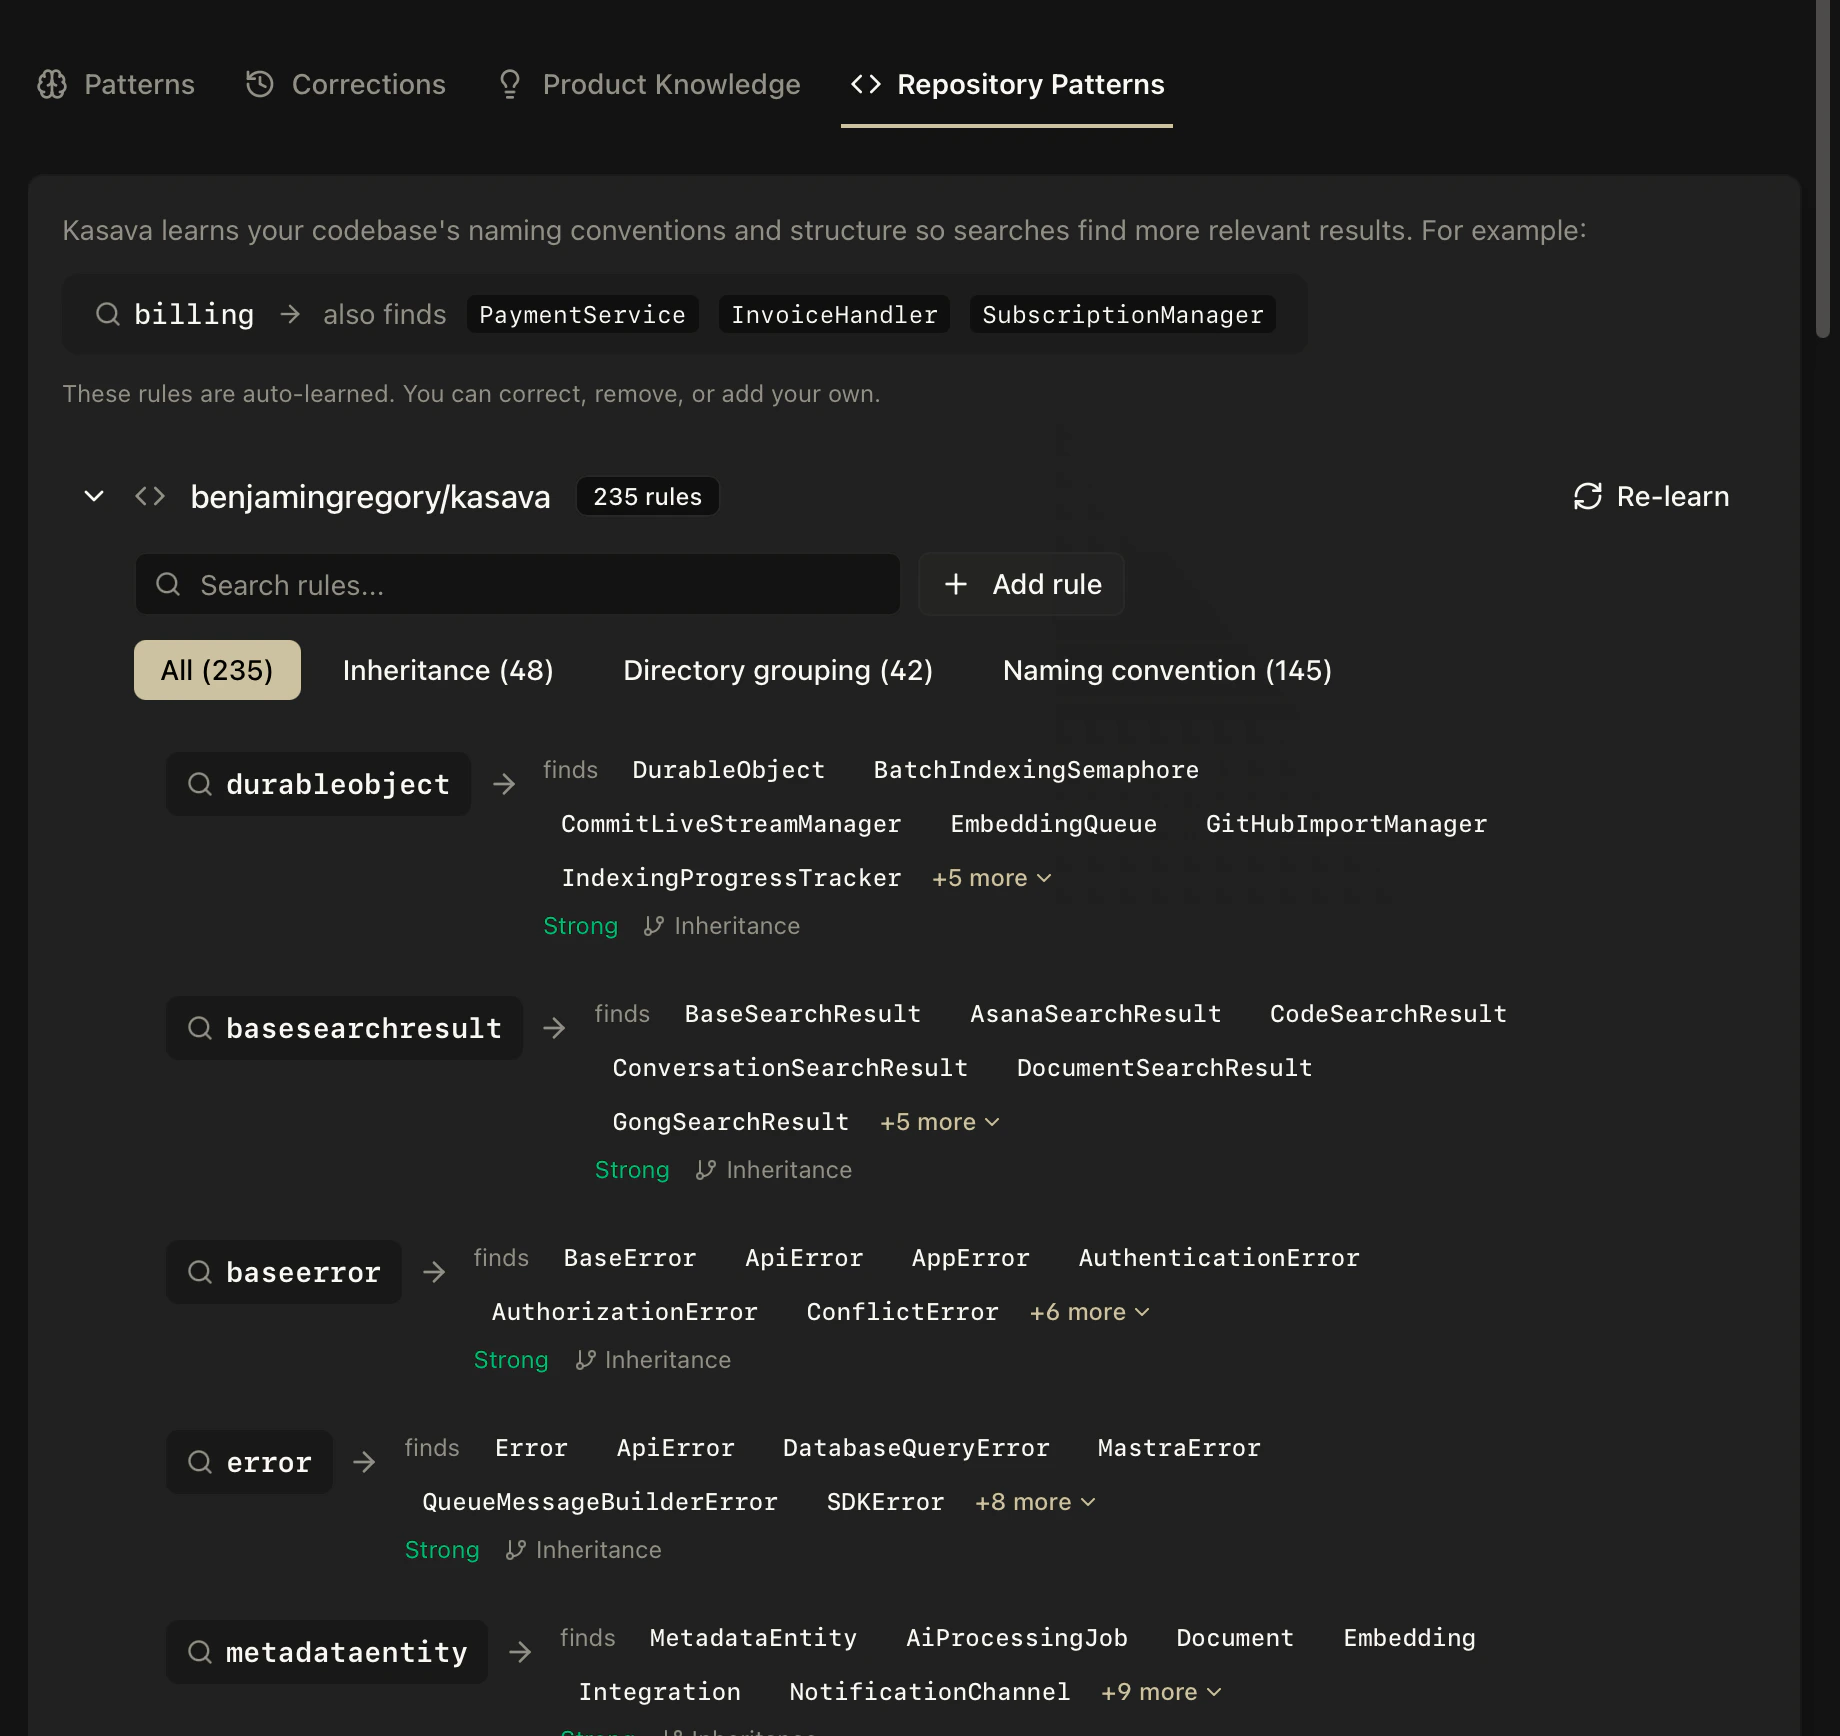
This is what sets Kasava apart from aggregator dashboards and general-purpose AI assistants.AST-level code analysis
Kasava parses 32+ languages with tree-sitter to extract:- Symbols — functions, classes, methods, interfaces, types
- Call graphs — which functions call which, with edge metadata
- Import relationships — real dependency edges, not prose guesses
- Pattern detection — providers, state stores, custom hooks, service classes, cross-cutting concerns
AuthService depends on TokenStore because it traced the actual imports. Not because someone wrote a wiki page that went stale six months ago.
Commit analysis
Every commit is classified (feature, fix, refactor, chore), linked to feature areas and architectural layers, and scored for impact. Over time, this builds a living history of what’s shipped, by whom, and where — the signal you need to answer questions that static dashboards can’t.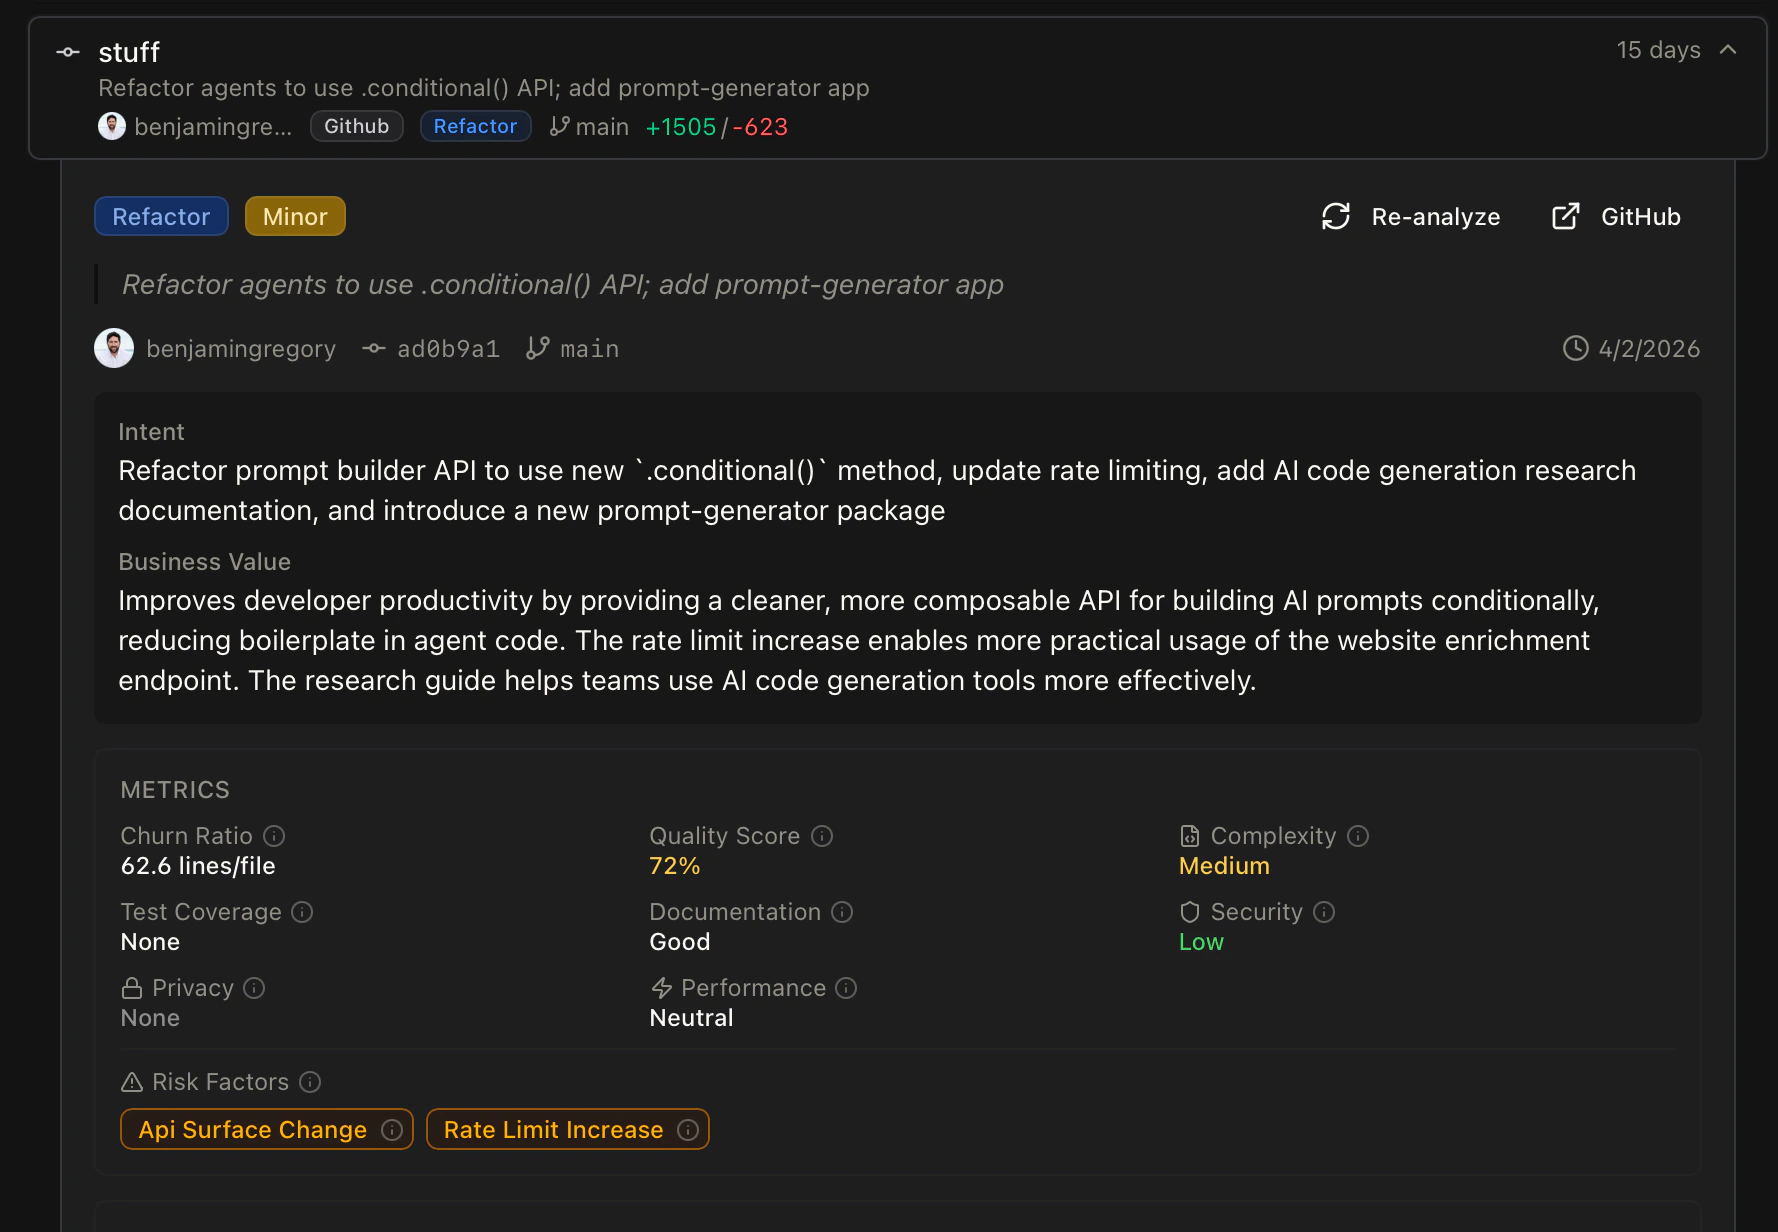
Why does Kasava do this?
Questions this actually answers
Because the graph understands code structure and commit history, it can answer questions a generic chatbot can’t:- “Is this issue still relevant?” — Kasava checks whether the files the issue referenced have been touched or refactored since it was filed. Stale issues get flagged automatically.
- “Are we going to finish everything in this sprint?” — Velocity, in-progress PRs, code complexity of remaining work, and historical commit throughput per feature area combine into a grounded forecast. Not a vibes call.
- “What would break if we change the auth middleware?” — Full call-graph traversal across the symbol graph returns the exact files, features, and tests impacted.
- “Why is this plan stale?” — Referenced code files haven’t changed in 90 days; work has shifted elsewhere; the plan needs a review.
More accurate plans and documents
When the underlying knowledge is grounded in real code, everything downstream gets sharper:- Specs reference actual symbols — not prose like “the user service”
- Work breakdowns include real file paths and code context from your repositories
- Generated PRDs cite existing patterns so implementation guidance is grounded, not invented
- Export to Linear/Jira/GitHub carries code context forward to the engineer actually picking up the work
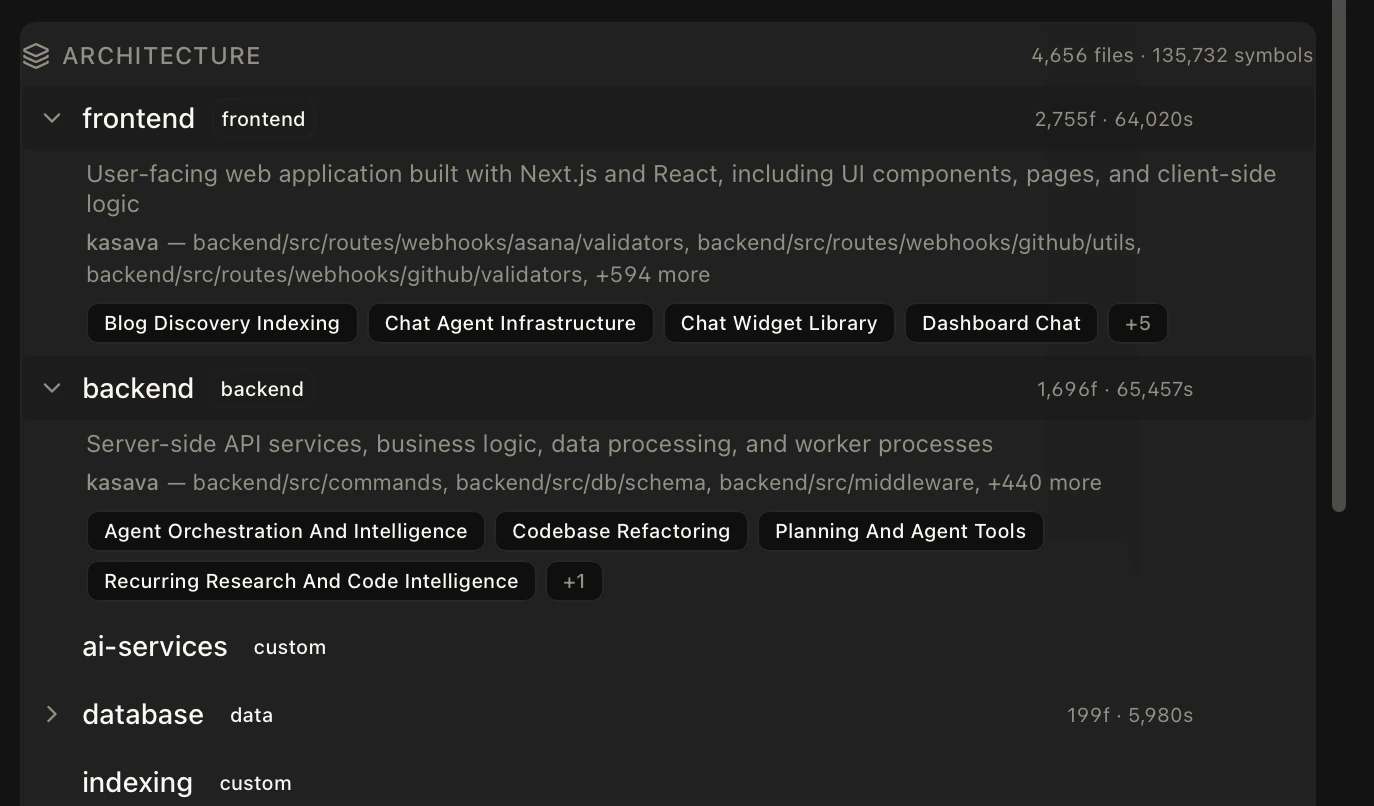
Architectural layers in depth
Layers are the “where” dimension of the graph. Every file in your repositories gets classified into a layer through a combination of path patterns (e.g.frontend/src/..., backend/routes/...) and framework-aware detection of directory roles like ui, service, config, api, and test.
Related
Workspaces
Bounded initiative containers that use the graph as context
Plans & Work Items
How the graph grounds specs and work breakdowns
The Kasava Agent
The chat agent that queries the graph on every message
Code Intelligence
The indexing pipeline that populates the code graph